
Real estate visit metrics: the ones that truly matter

The essential metrics to track for physical visits are the number of visits per listing, the attendance rate, the no-show rate, the visits→offers conversion rate, and the feedback request delay. Automating their collection with software like VisitSync reduces manual work, protects your schedule, and mechanically improves your visit conversion rate.
In short:
- Automatic collection of visit data allows tracking key indicators such as attendance rate, no-show rate, or visits-to-offers conversion, while avoiding manual errors.
- Segmenting by source, property type, or agent improves the accuracy of analyses and prevents drawing erroneous conclusions for the entire real estate portfolio.
- An immediate feedback delay, ideally within two hours after the visit, increases the relevance of comments and facilitates quick adjustments to listings.
- Daily monitoring of no-show rates and appointments allows for quick action to reduce cancellations and optimize visit planning.
- Automating reminder and feedback request management with software like VisitSync improves responsiveness and data quality while protecting the real estate agent's schedule.
Table of Contents
- Which real estate visit metrics should you really track?
- How to calculate each KPI without biasing the results?
- How to automate the collection of visit data?
- How to identify leaks in your visit pipeline?
- What does a good visit dashboard look like?
- What automation concretely changes on the ground
- VisitSync transforms your visits into actionable data
- Sources
- Frequently asked questions
Which real estate visit metrics should you really track?
An agent who notes down appointments in a notebook never sees where their pipeline is leaking. The following indicators form the minimal basis for serious real estate visit analysis, and each answers a specific business question.
- Visits per listing: how many people physically viewed the property over a given period. A low figure over several weeks points to an online visibility or listed price issue.
- Appointment attendance rate: proportion of confirmed appointments that actually take place. It measures the quality of your reminder system, not the quality of the property.
- No-show rate: the inverse of the above, often looked at in isolation because it triggers immediate corrective actions (SMS follow-up, confirmation the day before).
- Visits→offers conversion rate: proportion of visits conducted that result in a purchase or rental offer. This is the indicator that truly speaks to a seller or agency director.
- Feedback delay: time elapsed between the visit and the visitor's feedback. A lengthening delay degrades the quality of information gathered.
A sudden variation in the visits→offers rate almost always calls for a re-evaluation of the listed price or the listing description, not a questioning of the agent's work on the ground. The number of visits and the no-show rate are monitored daily, while an agency director would rather look at conversion and feedback delay on a monthly cadence, a statistically more stable period.
How to calculate each KPI without biasing the results?
An incorrectly set formula skews all subsequent analysis. Here are the standard calculations to apply systematically.
- Appointment attendance rate = (visits realized ÷ confirmed appointments) × 100.
- No-show rate = (missed appointments ÷ confirmed appointments) × 100, never calculated on the total number of requests received.
- Visits→offers conversion rate = (offers received ÷ visits realized) × 100, over a minimum 30-day window to smooth out buyer reflection times.
- Average feedback delay = sum of individual delays ÷ number of visits for which feedback was received.
A 7-day window is suitable for detecting an urgent operational problem (a series of no-shows for the same listing). A 30 to 90-day window provides a reliable reading of the conversion rate, as real estate purchase decisions are almost never made in a week. Always segment by contact source (portal, own website, recommendation), by property type, and by agent: an aggregated average rate often masks a single listing that drags down the overall average.
Pro tip: Never compare a conversion rate calculated over 7 days to one calculated over 30 days. This is the most frequent error I observe in handcrafted spreadsheets.

How to automate the collection of visit data?
Manual collection is the primary source of incomplete data. A visitor who cancels by text to an agent noting it on a sticky note means a no-show that will never appear in any statistics. The workflow that solves this problem follows a simple logic.
- The tenant or buyer books directly online on a dedicated property page, without creating an account.
- The appointment automatically syncs with the agent's calendar, Google or Outlook.
- An automatic reminder is sent before the visit, mechanically reducing the no-show rate.
- The visit outcome (completed, canceled, no-show) is marked with a single click, feeding the dashboard without manual re-entry.
- A feedback request is sent immediately after the visit, while the visitor's impression is still fresh.
The timing of this last step changes everything. Feedback requested on the same day captures precise impressions on price, property condition, or layout, while a request sent three days later mostly collects vague answers or no response at all. VisitSync specifically builds this type of automated chain, from booking to analysis, for real estate professionals managing multiple listings concurrently.
Pro tip: Schedule the feedback request to be sent automatically within two hours of the visit's end time, never the next morning.
How to identify leaks in your visit pipeline?
A real estate pipeline reads like a four-stage funnel: contacts, appointments, completed visits, offers. Calculating the ratio between each stage reveals where sales energy is lost, a method confirmed by sector analyses on the instrumentation of funnel stages.
- Low Contacts → appointments: the problem often comes from initial response speed, a lever documented by benchmarks on real estate lead conversion.
- Low Appointments → visits (high no-show rate): strengthen reminders and day-before confirmation rather than the sales script.
- Low Visits → offers: the property is well-visited but fails to convince. Look at the price, presentation condition, or the relevance of visitors sent (poor upstream qualification).
After each corrective action, measure the effect over a 30-day window before concluding. An improvement in only the contacts→appointments ratio, without a correlated improvement in visits→offers, indicates that you are attracting more people without better qualifying serious buyers. The best practices in real estate sales show that the most successful agencies work on both ratios simultaneously, never one without the other.
What does a good visit dashboard look like?
A useful operational dashboard fits on a single screen, not twelve spreadsheet tabs. It should answer three questions in less than thirty seconds: how are my visits doing this week, which listings are underperforming, and which agent needs help.
- A trend in the number of visits over 7 and 30 days, displayed as a curve rather than a raw table.
- A ranking of listings by number of visits and conversion rate, to quickly identify properties with high traffic but low transformation.
- An appointment attendance rate and no-show rate by contact source.
- A visual alert for listings that accumulate many visits but few offers, indicating a price or presentation issue to address as a priority.
A daily review is suitable for monitoring no-shows and daily reminders. The weekly review is for the team leader, who compares agents. The monthly review goes to the agency director to arbitrate prices and marketing strategies for stagnant listings.
What automation concretely changes on the ground

The most common mistake I see among independent agents is not a lack of sales skill. It's the absence of segmentation: they follow a single global conversion rate, without distinguishing between new and old properties, or between contact sources. The second mistake, almost as frequent, is delayed feedback tracking, often done "when there's time," which amounts to never seriously analyzing it.
Automation does not replace the agent's business judgment, but it eliminates tasks where humans err most: forgetting a reminder, reacting too late to a cancellation, letting a feedback request slip. Agencies that have implemented systematic reminders and immediate feedback requests generally see more actionable feedback and a schedule better protected against ghost slots.
— Isac
VisitSync transforms your visits into actionable data
VisitSync is the direct alternative to manual real estate visit tracking on spreadsheets or appointment books: every booking, reminder, and visit feedback is automatically recorded, without manual re-entry and without risk of oversight.
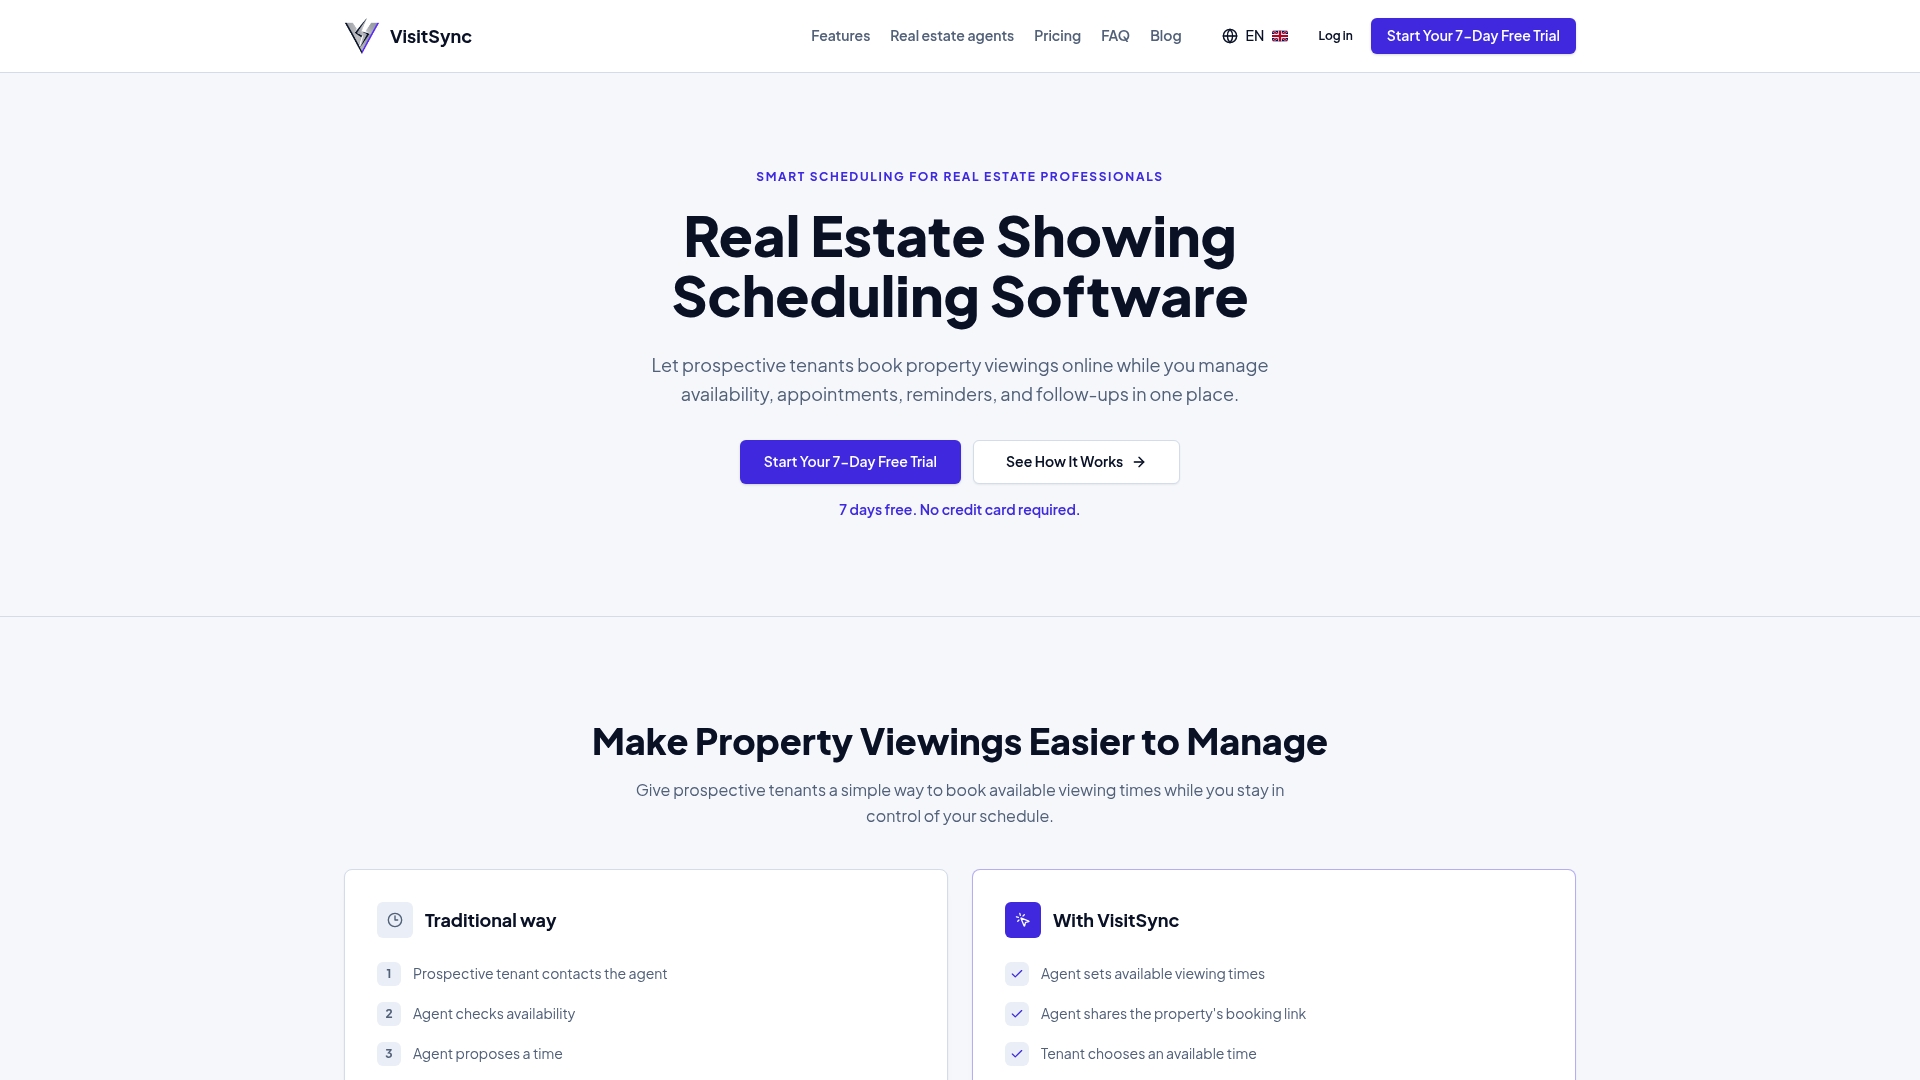
Concretely, a buyer books their visit online without creating an account, the appointment syncs with your Google or Outlook calendar, and the system sends reminders and feedback requests at the right time, maximizing response rates. You then retrieve your visit metrics (appointment attendance rate, no-show rate, visits→offers conversion) already calculated, without having to rebuild them manually every week. VisitSync offers several monthly subscription plans to adapt to the needs of individual agents and real estate teams. Consult the detailed VisitSync features for agents and start your trial period on VisitSync.
Sources
The conversion benchmarks cited in this article are based on local showings-to-sales conversion analyses, industry benchmark reports, and studies on sales response speed. To delve deeper into the practical features mentioned (calendar synchronization, automatic reminders), the VisitSync features page details each component of the workflow.
- Q2 2026 Online Sales Benchmarks | Do You Convert
- Real Estate Lead Conversion Rate: 2026 Benchmarks | Ventix AI
- 2026 Conversion Research & Benchmark Report
Frequently asked questions
What is a good visits-to-offers conversion rate?
There is no single standard, but a local market analysis shows an average showings-to-sales conversion rate around 3.8%. Always compare this rate to your own history and property segment rather than a national average.
How to reduce the no-show rate for visits?
An automatic reminder sent the day before and on the day itself remains the most effective lever, as most no-shows stem from simple forgetfulness rather than actual disinterest. Automating this step with a tool like VisitSync eliminates dependence on an agent having to remember manually.
How often should visit metrics be analyzed?
Monitor the number of visits and the no-show rate daily, and reserve a more in-depth analysis of the visits→offers conversion rate on a monthly basis. Real estate purchase decisions take time; a short window provides too noisy an image to be reliable.
Does VisitSync's price vary depending on agency size?
VisitSync offers different monthly subscription plans tailored for real estate professionals, with options for independent agents and teams. Full details of both offers are available on VisitSync.
Why does the feedback request delay influence data quality?
A visitor asked for feedback quickly remembers their impressions of the price, condition, or layout of the property precisely, making the feedback usable for adjusting the listing. After a few days, the response rate drops, and comments become too vague to guide a business decision.