
Visit Conversion Rate: How to Calculate and Improve It

The visit conversion rate measures the percentage of scheduled or completed property visits that result in a serious application, a signed lease, or a closed sale. Keep a simple benchmark in mind: if your tour-to-application conversion rate drops below 30%, it's an operational red flag that needs immediate attention. Tools like VisitSync help capture and analyze these events, visit after visit, to identify problems before they become costly.
In brief:
- A tour-to-application rate below 30% signals an operational failure requiring immediate intervention.
- It is crucial to track the status, timestamp, and final outcome of visits to effectively measure conversion.
- Virtual tours can reduce time on the market by approximately 26% and better qualify prospects before a physical visit.
- Automating appointment scheduling, responding quickly to leads, and reducing no-shows with reminders significantly improve conversion within 90 days.
- Using a tool like VisitSync helps centralize data, track key indicators, and optimize the process without manual re-entry.
Table of Contents
- How to Calculate the Visit Conversion Rate
- What Data to Track to Seriously Measure Your Visit Funnel
- What Numeric Benchmarks Indicate a Conversion Problem
- Why Your Visits Aren't Converting and How to Fix It in 90 Days
- What Really Works to Increase Visit Conversion
- How VisitSync Helps Measure and Improve This Rate Daily
- The Roadmap I Would Recommend to Any Team
- Test VisitSync to Turn Your Visits into Applications
- Sources
- Frequently Asked Questions
How to Calculate the Visit Conversion Rate
Two formulas are enough to manage most of your activity. The first measures conversion into applications:
Tour→Application Rate = (submitted applications ÷ completed visits) × 100
The second goes further down the sales funnel:
Tour→Lease or Sale Rate = (signed transactions ÷ completed visits) × 100
Two methodological rules help avoid false results:
- Set a clear attribution window: link the application to the initial inquiry period, or define a fixed window (7 or 14 days after the visit, for example) and keep it constant from one month to the next.
- Precisely define what you call a “visit”: an agent-accompanied visit and a self-guided visit do not have the same natural completion rate, so never mix them in the same calculation without distinguishing them.
To compare your figures over time, always apply the same definition from one month to the next. A change in calculation method during the quarter makes your comparisons unusable.
What Data to Track to Seriously Measure Your Visit Funnel
A reliable conversion rate relies on rigorous data collection, not an estimate at the end of the month. The following fields are the bare minimum:
- Lead source (portal, owner website, referral, social network)
- Visit type (agent-accompanied or self-guided)
- Identity of the host who conducted the visit
- Visit status (planned, completed, cancelled, no-show)
- Timestamp of the booking and timestamp of the visit itself
- Final outcome (application submitted, no application, no-show)
Two additional indicators deserve separate tracking: lead response time (measure the median, but especially the 90th percentile, which reveals your worst cases) and adherence to a maximum response time objective. A CRM connected to your calendar (Google or Outlook) and your online application system eliminates manual re-entry, a classic source of errors.
Two pitfalls constantly recur in poorly collected data: double counting of the same rescheduled visit, and late leads that are forgotten to be re-integrated into the following month's calculation.
Pro Tip: Before changing anything in your process, export three months of raw data and recalculate your rates manually. You will often discover that your current tool undercounts no-shows, which artificially inflates your actual rate.

What Numeric Benchmarks Indicate a Conversion Problem
The rental sector has some solid benchmarks to gauge your performance. The average lead-to-lease rate is around 8.7% for the market average, compared to 16.5% for the best operators, a difference that shows the potential gain simply by professionalizing follow-up.
Key Benchmark: a tour-to-application rate below 30% is correlated with longer vacancy periods, higher leasing costs, and increased abandonment of applications in progress.
Other funnel benchmarks refine the diagnosis: approximately 25% of inquiries convert into scheduled visits, 40% of visits into applications, and 70% of approved applications result in a signed lease. A portfolio of high-end properties with low volume cannot be directly compared to a large rental complex with high turnover: adjust your internal objectives to the actual mix of your activity rather than a national average.
Why Your Visits Aren't Converting and How to Fix It in 90 Days
Many visits but few applications generally point to an host or presentation quality issue, not a lack of demand. Conversely, few visits despite a high volume of inquiries signals a responsiveness or upfront qualification problem. Response time and follow-up consistency are among the most cost-effective levers to address quickly.
A three-phase roadmap structures the effort without dispersing it:
- Days 0 to 30: Automate appointment booking, enforce a maximum lead response time, revise poor photos and descriptions, activate automatic confirmations and reminders.
- Days 31 to 60: Test a virtual tour on part of the portfolio, add two or three pre-qualification questions at the time of booking, and measure the conversion difference before/after on a comparable sample.
- Days 61 to 90: Connect your CRM to your booking tool, automate weekly reporting of key indicators, and formalize a welcome script with coaching for less performing hosts.
Pro Tip: Change only one variable at a time between phases 31 and 60. If you introduce virtual tours AND pre-qualification simultaneously, you'll never know which one produced the result.
What Really Works to Increase Visit Conversion
Certain tactics have proven effective beyond anecdotal evidence. Virtual tours top the list: a 2025 study measures a reduction in time on the market of approximately 26% thanks to this feature, with an equally useful side effect: virtual tours pre-qualify prospects upfront and reduce the number of unnecessary physical visits, which mechanically improves the conversion rate of the remaining ones.
Other levers, simpler to activate, combine their effects:
- Two or three pre-qualification questions at the time of booking (budget, desired move-in date, household composition) filter out less serious visitors before they even visit.
- Automated reminders 24 hours and 2 hours before the visit significantly reduce the no-show rate, often the first invisible leak in the funnel.
- A 60 to 90-second welcome script, supported by a standardized visit checklist, increases the completion and quality of subsequently submitted applications.
None of these tactics require a heavy budget. Their common point: they reduce friction between initial prospect interest and the act of applying.
How VisitSync Helps Measure and Improve This Rate Daily
VisitSync was designed so that data collection no longer relies on a manually kept Excel sheet. Online visit booking, synchronization with Google and Outlook, automatic reminders, and the visit analytics module together form the set of features that powers a simple operational dashboard.
A minimal yet sufficient dashboard should track:
- Number of scheduled visits for the week
- Number of actually completed visits
- Tour→application rate for the period
- No-show rate
- Median lead response time
For these figures to be actionable, some settings matter more than others: open calendar permissions to the entire relevant team, set an explicit maximum response time, and connect your CRM as soon as the volume of leads exceeds what an agent can manually track.
| Indicator tracked | Operational utility |
|---|---|
| Scheduled vs. completed visits | Detects no-show or cancellation problems |
| Tour→application rate | Measures the quality of the visit experience |
| Lead response time | Identifies losses upstream of the visit |
The Roadmap I Would Recommend to Any Team
Instrument first, optimize second: this is the order high-performing teams follow, and the one many agents invert due to impatience. The first 30 days are for ensuring reliable measurement, not for changing the welcome script. A simple weekly audit followed by a monthly cohort review is enough to transform approximate management into decisions based on real figures. Prioritize tracking three indicators: the tour→application rate, the no-show rate, and the lead response time. Everything else is noise until these three are under control.
*— Isac
Test VisitSync to Turn Your Visits into Applications
VisitSync is the alternative to manual visit coordination by phone and email for agents who waste time cross-referencing availabilities. The concrete difference: fewer no-shows thanks to automatic reminders, structured visit data collection without re-entry, and operational time recovered for client support rather than logistics.
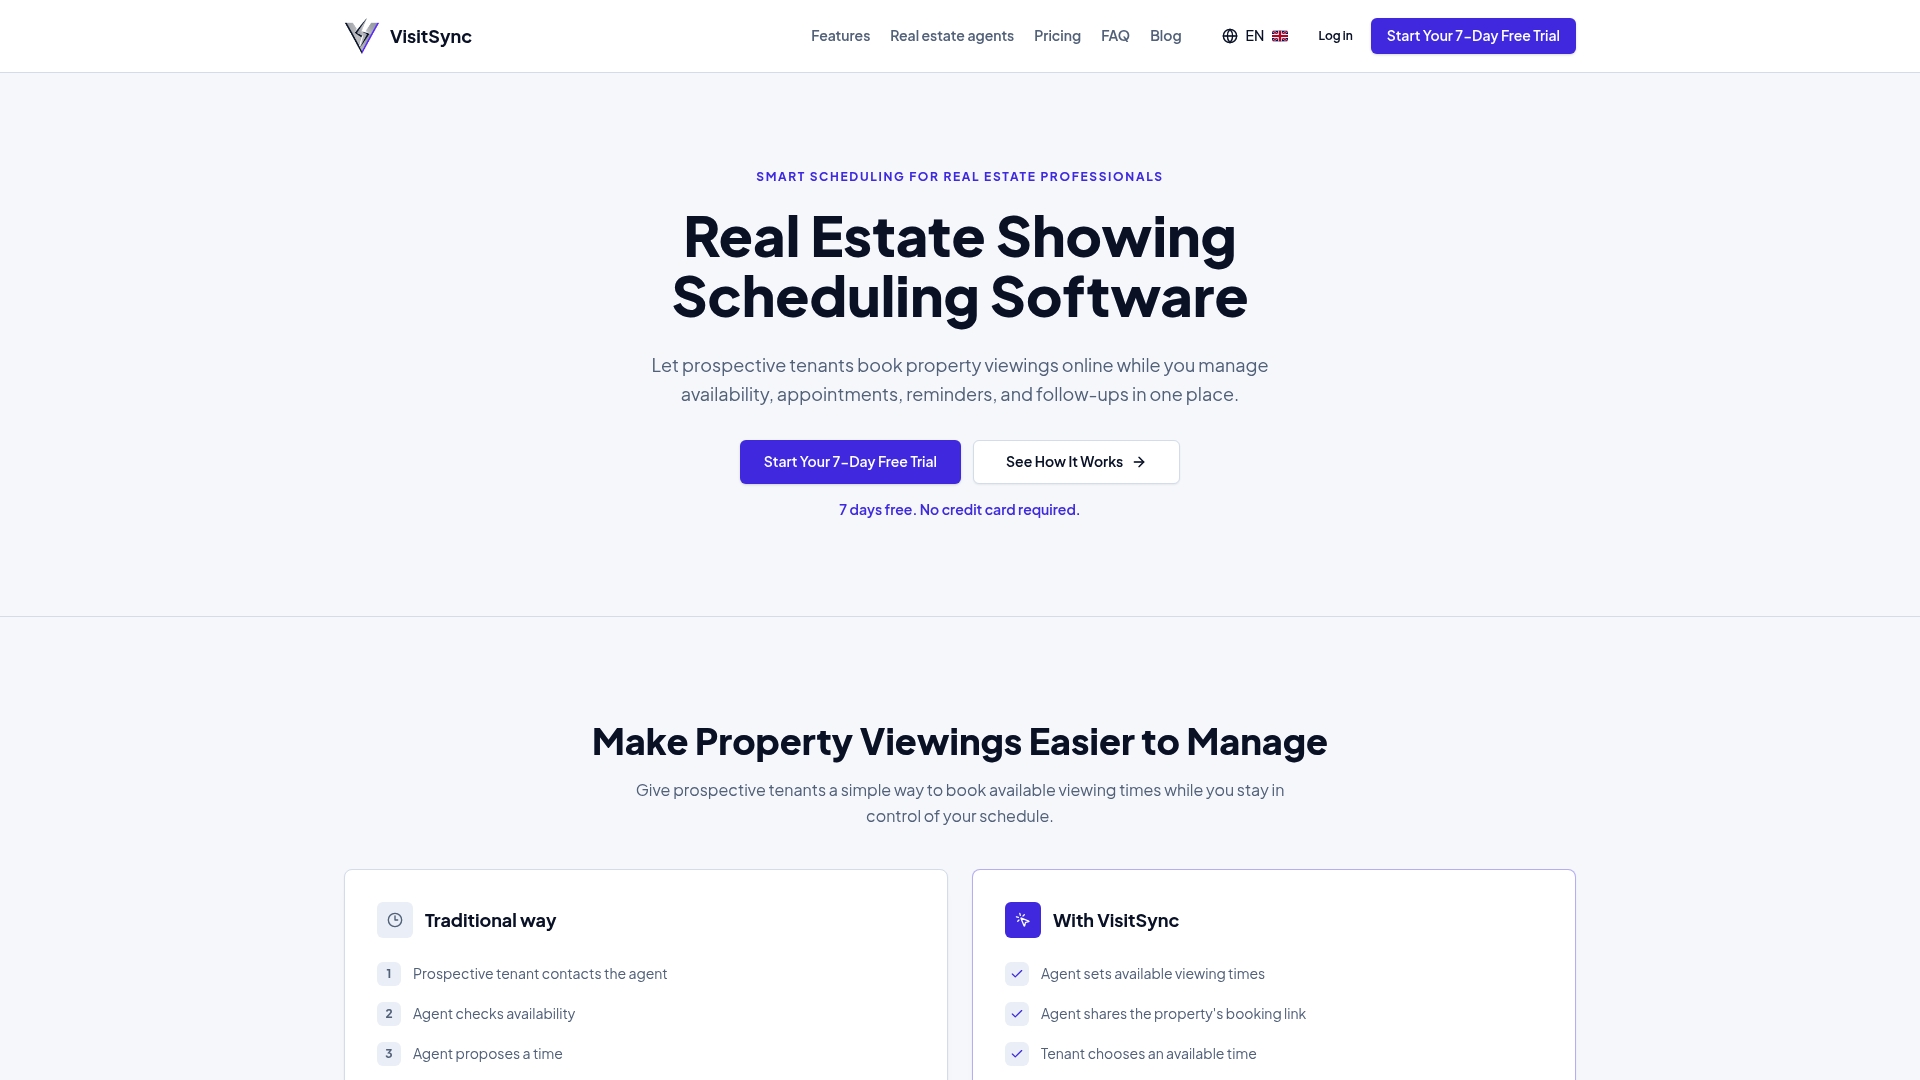
Whether you are an independent agent or a member of a real estate team, the starting point is the same: configure your booking page and let the tool capture every visit event from day one. Visit Visitsync to start your trial.
Sources
Frequently Asked Questions
What is a good visit conversion rate?
A tour→application rate around 40% is considered healthy, while a rate below 30% generally signals a problem with the visit experience or lead qualification. For the overall lead-to-lease rate, the market average is around 8.7%, compared to 16.5% for top operators.
How to calculate the conversion rate of a property visit?
Divide the number of submitted applications by the number of completed visits, then multiply by 100. Keep the same attribution window from one month to the next for your comparisons to remain valid.
Does the virtual tour really improve conversion?
Yes: a study published in 2025 measures a reduction in time on the market of approximately 26% thanks to virtual tours, which also pre-qualify prospects before the physical visit. This reduces the number of unnecessary visits and concentrates effort on genuinely interested prospects.
What data should be tracked first to measure this rate?
The status of each visit (planned, completed, no-show), booking timestamp, outcome (application or not), and lead response time are the minimum fields. A tool like VisitSync centralizes this data through its dedicated visit management features page.
How much does VisitSync cost for a real estate team?
Available offers include several monthly subscription tiers with various features such as calendar synchronization and automated reminders, as well as advanced analytics options. For up-to-date details, consult the VisitSync website directly.